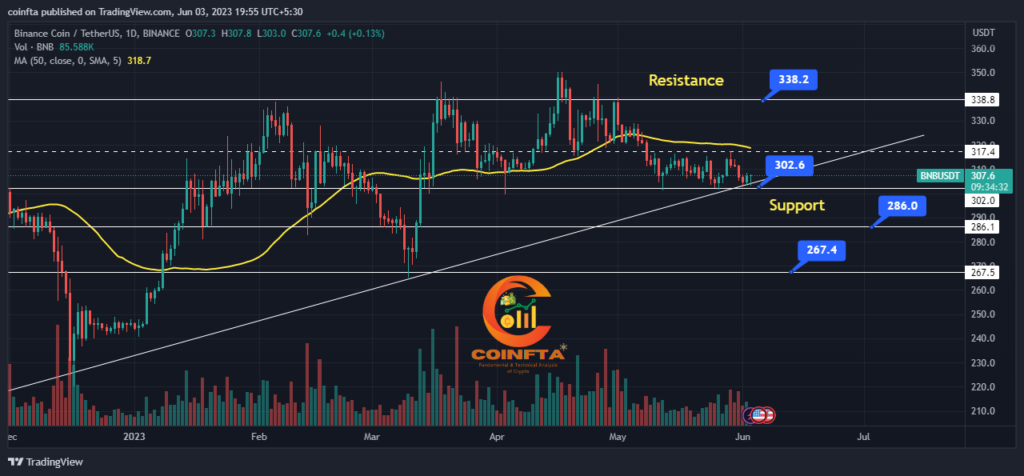
As on June 3, 2023 Binance Coin BNB is priced at $307. From a technical analysis perspective, BNB coin is presently experiencing a downtrend on the daily timeframe. The price resides below the 50 Day and 20 Day moving averages MA, indicating a bearish sentiment.
To comprehend the existing levels of support and resistance for BNB, we must examine the historical price data. Analyzing Binance coin BNB daily chart reveals a trading range of $302 to $316 over the recent days.
BNB coin crucial support level lies at $302, significantly impacting the cryptocurrency. A dip below this level could potentially lead to further price decline, with the subsequent support level positioned at $286.
Conversely, Binance coin BNB current resistance level resides at $317. A successful breakthrough beyond this level may initiate a bullish trend, with the subsequent resistance level set at $338.

Utilizing technical analysis indicators such as the Relative Strength Index (RSI) and Moving Averages can enhance our comprehension of the prevailing trend.
The RSI currently demonstrates a reading of 44, indicating a neutral zone where neither the bulls nor the bears hold significant dominance.
Regarding Fibonacci levels, BNB coin presently stands at 0.382, equivalent to $301. This level is computed by calculating 0.382 multiplied by the difference between the previous trend’s highest and lowest points. It holds significance as a potential support or resistance level within a trend.
Binance Coin BNB is consolidating within range of $302 to $316 featuring resistance zone positioned AT 0.286 $319 Fibonacci level and support zone located AT 0.382 $302 Fibonacci level. Trend line support also present at $302 as you can see on chart which indicate expected bounce.
Based on Fibonacci extensions and previous resistance levels, the upcoming targets for BNB are $317 and $338.
However, failure to sustain above $302 might prompt further selling pressure, potentially driving BNB towards key support levels at $286 and $267.


