As on June 29, 2023 Bitcoin is priced at $30453. From a technical analysis perspective, BTC price chart today presently experiencing a uptrend on the daily timeframe. The price resides above the 50 and 20 weekly EMA indicating a bullish sentiment.
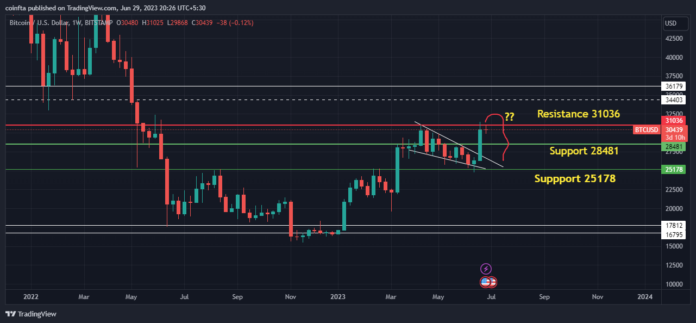
To comprehend the existing levels of support and resistance for Bitcoin, we must examine the historical price data. Analyzing BTC daily chart reveals a trading range of $31046 to $28,481 over the recent days.
Bitcoin crucial support level lies at $28481 significantly impacting the cryptocurrency. A dip below this level could potentially lead to further price decline, with the subsequent support level positioned at $25,178.
Conversely, BTC current resistance level resides at $31046. A successful breakthrough beyond this level may initiate a bullish trend, with the subsequent resistance level set at $34403.
Utilizing technical analysis indicators such as the Relative Strength Index RSI and Moving Averages can enhance our comprehension of the prevailing trend.
The RSI currently demonstrates a reading of 62 indicating a bullish zone where the bulls hold significant dominance.
BTC Price Chart Analysis on Weekly Timeframe – Technical Analysis Crypto

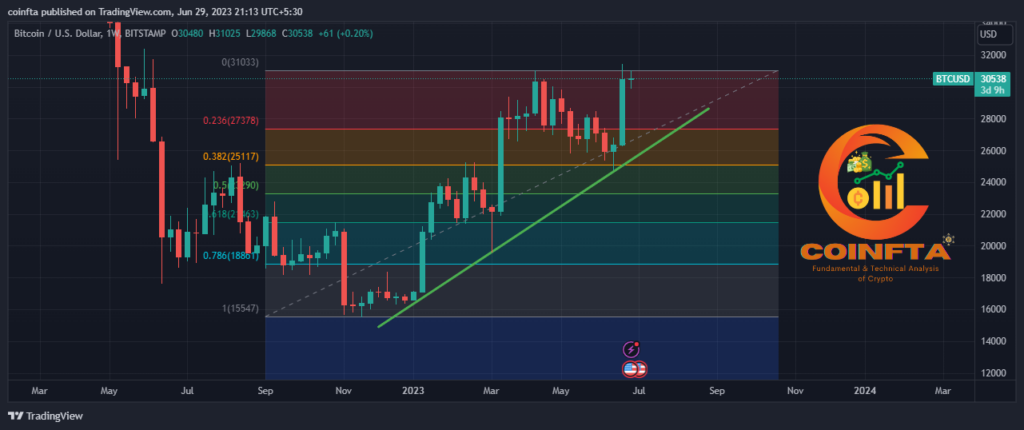
Regarding Fibonacci levels, from the bottom of $15547 to the recent top of $31035 on the weekly timeframe, bitcoin displaying bullish momentum. BTC price experienced a correction from $31035 and found support at the 0.382 level indicating bullish sign. BTC is currently trading above the 0.236 level which stands at $27,378.
Additionally the trendline in the above image is providing support to BTC as the same price. It this level is broken, the next support will be at 25178. This level holds significance as a potential support or resistance level within the trend.
Based on Fibonacci extensions and previous resistance levels, the upcoming targets for Bitcoin are $32k, $34K, and $36K.
However, failure to sustain above $28.4K might prompt further selling pressure, potentially driving bitcoin towards key support levels at $25k and $24k


