Hello crypto trader, welcome to CoinFTA where we share our insights and analysis on the latest trends and developments in the crypto market. In this post, we will discuss bitcoin technical analysis today and why the price of bitcoin is going down and what is the reason for the fall of the bitcoin price. Detailed BTC chart analysis report.
As you may have noticed, the crypto market has been experiencing a sharp decline in the past few days, with the price of BTC dropping by more than 11% and triggering massive liquidations across the board. What is behind this bearish movement and what can we expect from the future of bitcoin?
Bitcoin Technical Analysis Today – BTC Chart Analysis Today
To answer these questions, we need to look at the BTC technical analysis today and patterns that are shaping the bitcoin price action. One of the most prominent patterns that we observed recently is the head and shoulders pattern that formed on the daily bitcoin chart. This is a bearish reversal pattern that signals a potential change in the trend from bullish to bearish.
The head and shoulders pattern consists of three peaks, with the middle one being the highest (the head) and the two on either side being lower (the shoulders). The pattern is completed when the price breaks below a horizontal line that connects the lows of the two shoulders (the neckline). This indicates that the buyers have lost control and the sellers have taken over.

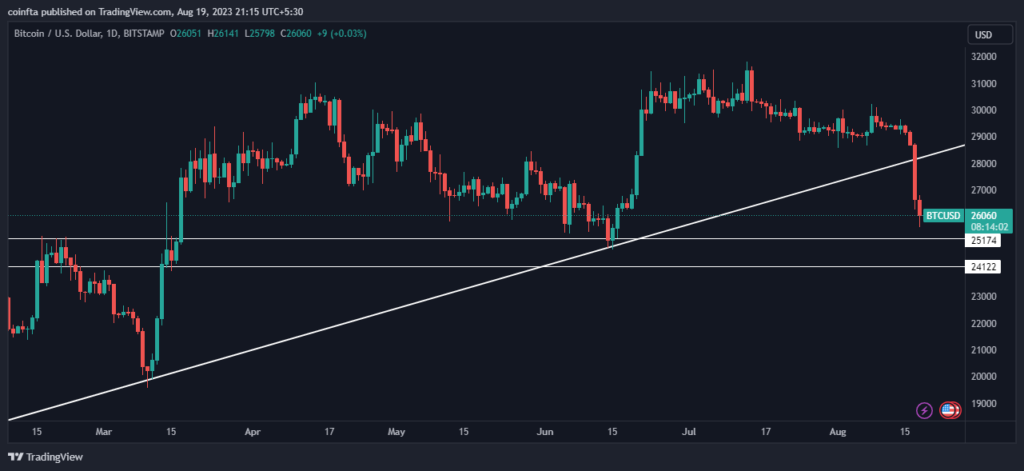
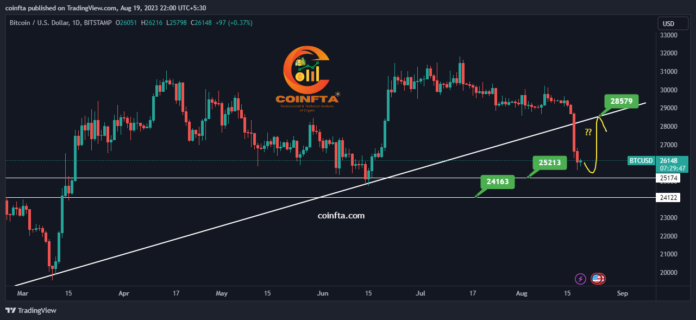
This is exactly what happened on August 18th 2023, when the bitcoin price broke below the neckline around $28000 and plunged to around $25100, confirming the head and shoulders pattern. This was a major bearish signal that triggered a lot of selling pressure and panic in the market.
But what does this mean for the future of bitcoin? Is this the end of the bullrun or just a temporary correction? To answer this, we need to look at some other technical factors that can influence the bitcoin price.
One of these factors is the support and resistance levels that act as barriers for the price movement. Support is a level where the price tends to bounce back from a downtrend, while resistance is a level where the price tends to reverse from an uptrend. These levels are determined by historical data, psychological factors, and market sentiment.
| Coin/Token | Bitcoin |
| Symbol | BTC |
| Support | $25100 and $24100 |
| Resistance | $28000 |
Right now, one of the key support levels for bitcoin is around $25100, which is also below to the 200-day moving average (a line that represents the average price of bitcoin over the past 200 days). This level has acted as a strong support in the past and could provide some stability for the bitcoin price in the short term.
However, if this level fails to hold, then we could see further downside for bitcoin, with the next support level being around $24100 which is also near the 300-day moving average (a line that represents the average price of bitcoin over the past 300 days). This level could be another potential bounce point for bitcoin, but if it also breaks, then we could enter a deeper bearish phase, with the next support level being around $18000 This level is considered as a long-term trend indicator and a major support for bitcoin analysis.
On the other hand, if bitcoin manages to recover from its current slump and reclaim some of its lost ground, then one of the key resistance levels to watch is around $28000, which is also where the neckline of the head and shoulders pattern is located. This level could act as a strong barrier for bitcoin’s upward movement and could trigger another wave of selling pressure if it fails to break above it.
However, if bitcoin manages to break above this level and invalidate the head and shoulders pattern, then we could see some bullish momentum for bitcoin, with the next resistance level being around $30000 which is also a psychological round number and a previous all-time high for bitcoin.
This level could be another challenge for bitcoin rally but if it also breaks then we could see more upside for bitcoin with the next resistance level being around $34000 which is also near another previous all-time high for bitcoin analysis today.
In conclusion, we can say that bitcoin technical analysis today is currently in a volatile and uncertain situation, with both bullish and bearish scenarios possible depending on how it reacts to various technical levels. As traders, we need to be cautious and flexible in our approach and use proper risk management techniques to protect our capital. We also need to avoid falling prey to market manipulation and emotions and rely on objective data and analysis to make informed decisions.
We hope you enjoyed this post and learned something new about bitcoin technical analysis. If you have any questions or feedback, please leave them in the comments section below. And don’t forget to join our telegram group CoinFTA for more updates on crypto trading.
Disclaimer: This technical analysis article is for informational purposes only and does not constitute financial, legal or investment advice. Please do your own research before making any decisions. We are not liable for any financial losses incurred.


