Hello Crypto Traders, today we will do bitcoin technical analysis. In this article, we will examine the key support and resistance levels of bitcoin and provide you with some insights on the possible price movements in the near future.
Let’s start by looking at the current price of bitcoin, which is $26260 at the time of writing. As you may know, bitcoin has experienced a significant drop from its $31800 peak and has been trading sideways for the last few days.
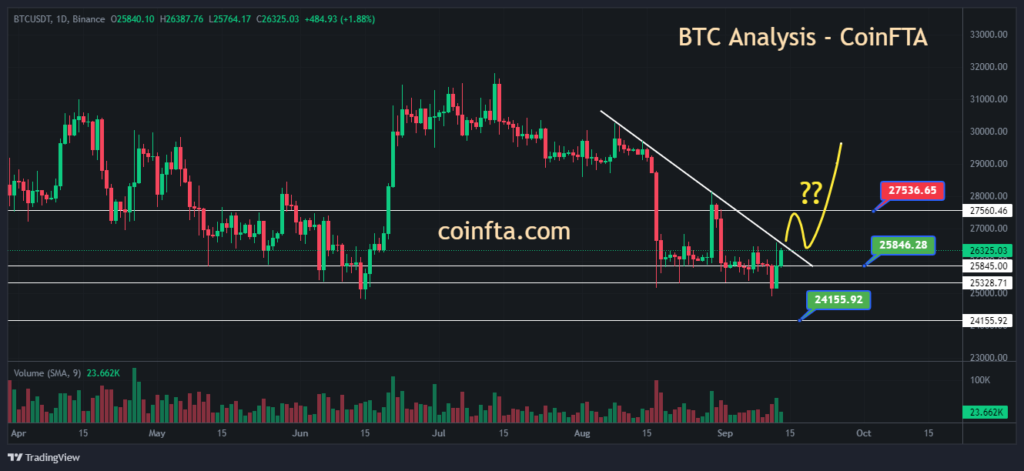
We have drawn some important trendlines on the bitcoin chart analysis to show you the support and resistance zones that Bitcoin is facing right now. As you can see, Bitcoin is approaching its critical support level of $25800.
This level has acted as a strong support in the past and if it holds, we may see a bounce back to the upside. However, if this level breaks, we may see a further decline to the next support level of $25300 or even $24200.

On the other hand, the current resistance level of Bitcoin is around $26400. This level has acted as a strong resistance in the past and if it breaks with a high volume, we may see a rally to the next resistance level of $27500.
However, if this level holds, we may see a rejection and a continuation of the downtrend. As you know, the crypto market is very volatile and unpredictable, so we advise you to trade with caution and use stop-loss orders to protect your capital.
Bitcoin Technical Analysis Today – BTC Chart Analysis
If we zoom out to the daily time frame, we can see that bitcoin price is trading below both the 50-day exponential moving average (EMA) and the 200-day exponential moving average. This indicates that Bitcoin is in a bearish trend and needs to break above these moving averages to reverse the trend.

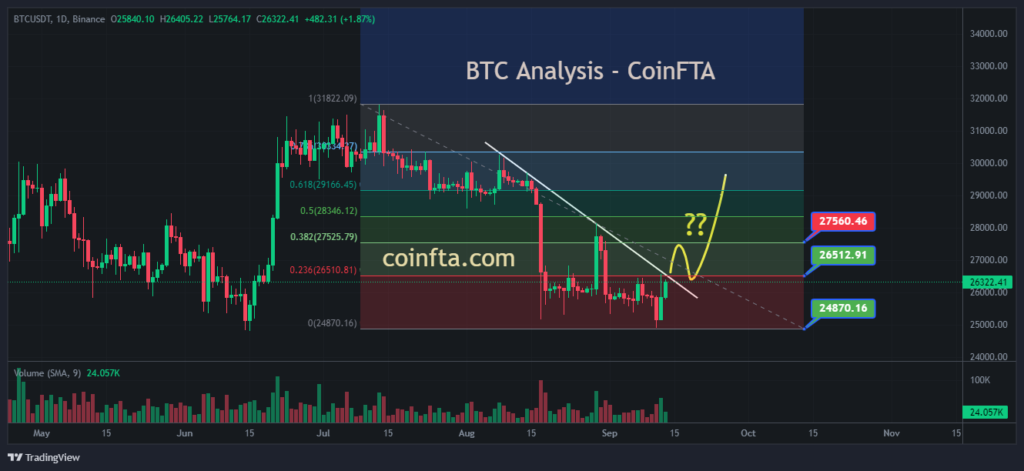
Similarly, if we apply the Fibonacci retracement tool from the top to the bottom of the recent swing, we can see in bitcoin analysis that BTC price is trading below the 0.236 level. This level is also a resistance zone and if Bitcoin breaks above it, we may see a move to the 0.382 level, which coincides with the $27500 resistance.
If we look at the RSI indicator, we can see that it is at 47, which is neutral. This means that neither the bulls nor the bears have a clear advantage at the moment and we need to wait for a decisive move in either direction. Overall BTC technical analysis today price showing sideways.
Bitcoin Analysis Today – FAQ
What is the current price of Bitcoin?
The current price of Bitcoin is $26250, which is below its $31800 top.
What are the important support and resistance levels of Bitcoin?
According to bitcoin analysis today, The important support levels of Bitcoin are $25800 and $25300, and the important resistance levels are $26400 and $27500.
What are the possible scenarios for the price of Bitcoin in the coming time?
Bitcoin technical analysis today, If Bitcoin breaks the resistance of $26400 with a good volume, it can go up to $27500. If Bitcoin breaks the support of $25800 or $25300, it can go down to $24200.
How to trade Bitcoin in this market?
The market is volatile and sideways, so it is advisable to trade with caution and use stoploss. If Bitcoin breaks the resistance of $26400 with a good volume, then it can go up to $27500. If it breaks the support of $25800 or $25300, then it can go down to $24200.
In conclusion, Bitcoin chart analysis today showing some important support and resistance levels and its price action will depend on whether it breaks or holds these levels. We will keep you updated on any major developments and provide you with more technical analysis in our future articles.
As you know, the crypto market is very volatile and unpredictable, so you should trade with caution and use proper risk management. Always use a stop loss to protect your capital and do not risk more than you can afford to lose. If you want to read more crypto technical analysis reports and articles, join CoinFTA and stay updated with the latest market trends.
Disclaimer: This technical analysis article is for informational purposes only and does not constitute financial, legal or investment advice. Please do your own research before making any decisions. We are not liable for any financial losses incurred.


