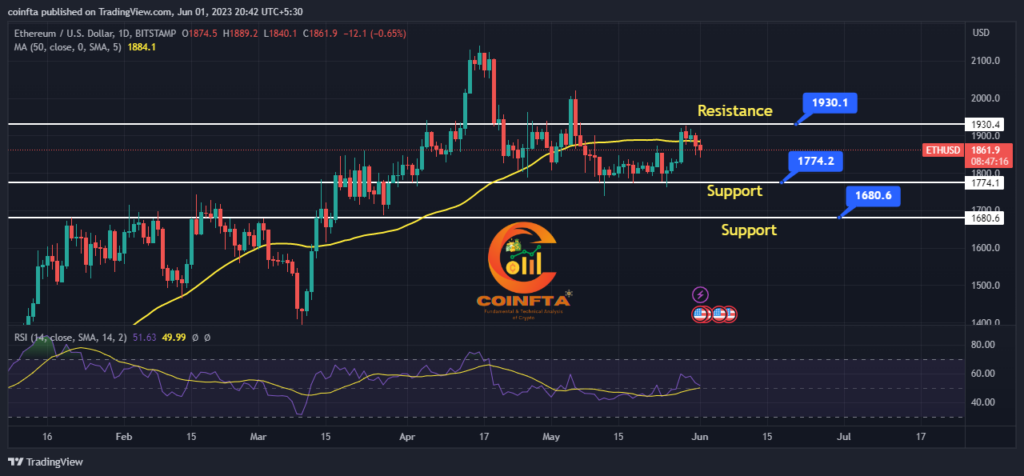
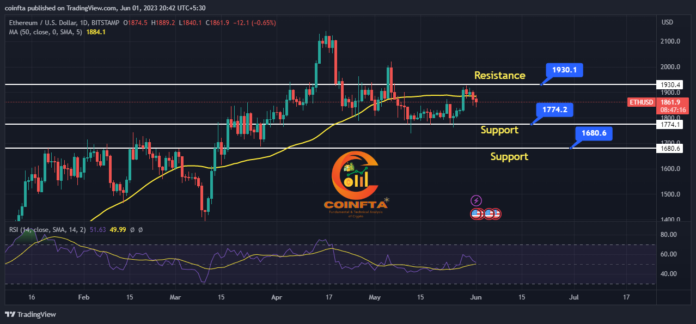
As on June 1, 2023 the current price of Ethereum (ETH) is $1863. From technical analysis perspective, Ethereum is presently experiencing a downtrend on the daily timeframe. The price is trading below the 50 daily moving average MA indicating bearish sentiment. Ethereum price technical analysis can be seen below ETH chart.
To comprehend the existing levels of support and resistance for ETH, we must examine the historical price data. Analyzing ETH daily chart reveals a trading range of $1774 to $1930 over the recent days.
Ethereum’s crucial support level lies at $1774, significantly impacting the cryptocurrency. A dip below this level could potentially lead ETH to further price decline, with the subsequent support level positioned at $1680.
Conversely, Ethereum current resistance level resides at $1930. A successful breakthrough beyond this level may initiate a bullish trend for ETH, with the subsequent resistance level set at $2123.

Ethereum Price Technical Analysis – ETH Price Update
Utilizing technical analysis indicators such as the Relative Strength Index (RSI) and Moving Averages can enhance our comprehension of the prevailing trend.
The RSI currently demonstrates a reading of 51, indicating a neutral zone where neither the bulls nor the bears hold significant dominance.
Regarding Fibonacci levels, Eth presently stands at 0.328, equivalent to $1845.16. This level is computed by calculating 0.382 multiplied by the difference between the previous trend’s highest and lowest points. It holds significance as a potential support or resistance level within a trend.
Ethereum is consolidating within range of $1774 to $1930 featuring resistance zone positioned at 0.236 Fibonacci level and support zone located at 0.382 Fibonacci level. Next major support at 0.618 golden fib ratio level price $1680.
Following the last bullish wave, Ethereum has completed a triple correction and may resume its uptrend upon breaking above the corrective channel.
Based on Fibonacci extensions and previous resistance levels, the upcoming targets for Eth are $1930, $2132.
However, failure to sustain above $1774K might prompt further selling pressure, potentially driving Eth towards key support levels at $1680 and $1530.


